Debugger
The plugin comes with a debugger that can prove extremely useful when debugging protocol logic, or to simply learn about how code is executed.
Usage
Starting the debugger is like starting a new engine, but using the debug icon.
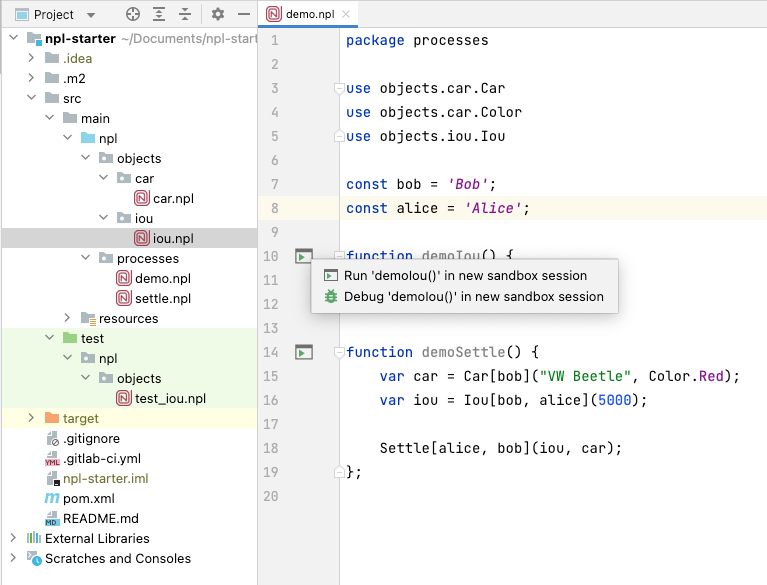
Once Debug '<name>()' in new sandbox session is clicked, you can watch the engine boot up in the Console tab.
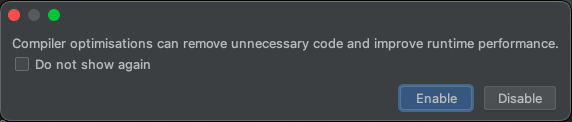
Additionally, you will be prompted to enable or disable compiler optimisations for automatic removal of statements without side effects, and statements which don't affect code execution.
Nothing seemingly happens once it has started, but on closer inspection you'll find the debugger hits a default
breakpoint internal:1, visible in the Debugger tab. This internal frame gives you a chance to add breakpoints, or
alternatively you can immediately start using the debugger controls (hitting Step Over causes it to jump to the first
line of code on the execution path, a useful feature).
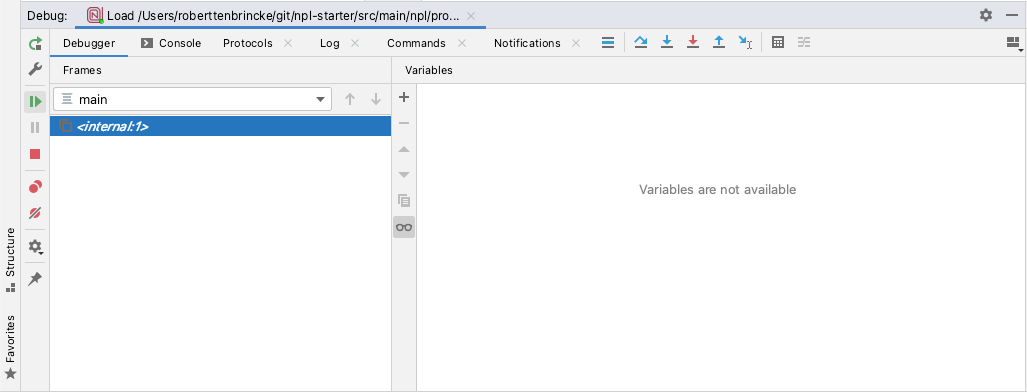
Hit the Resume Program play button to skip the internal breakpoint. At this point the engine has started.
At this point it's possible to set breakpoints and inspect frame values. Select a protocol instance by clicking on it in
the Protocols tab. This navigates us to the protocol's source code. Let's set a breakpoint, displayed as a red dot, at
the if-statement in the pay permission by clicking the grey space next to its line number. Once the pay permission
is invoked by clicking the green icon next to it, another internal:1 frame emerges in the debugger. Once we skip past
this using Resume Program, our breakpoint is hit. At this point the frame values are visible.
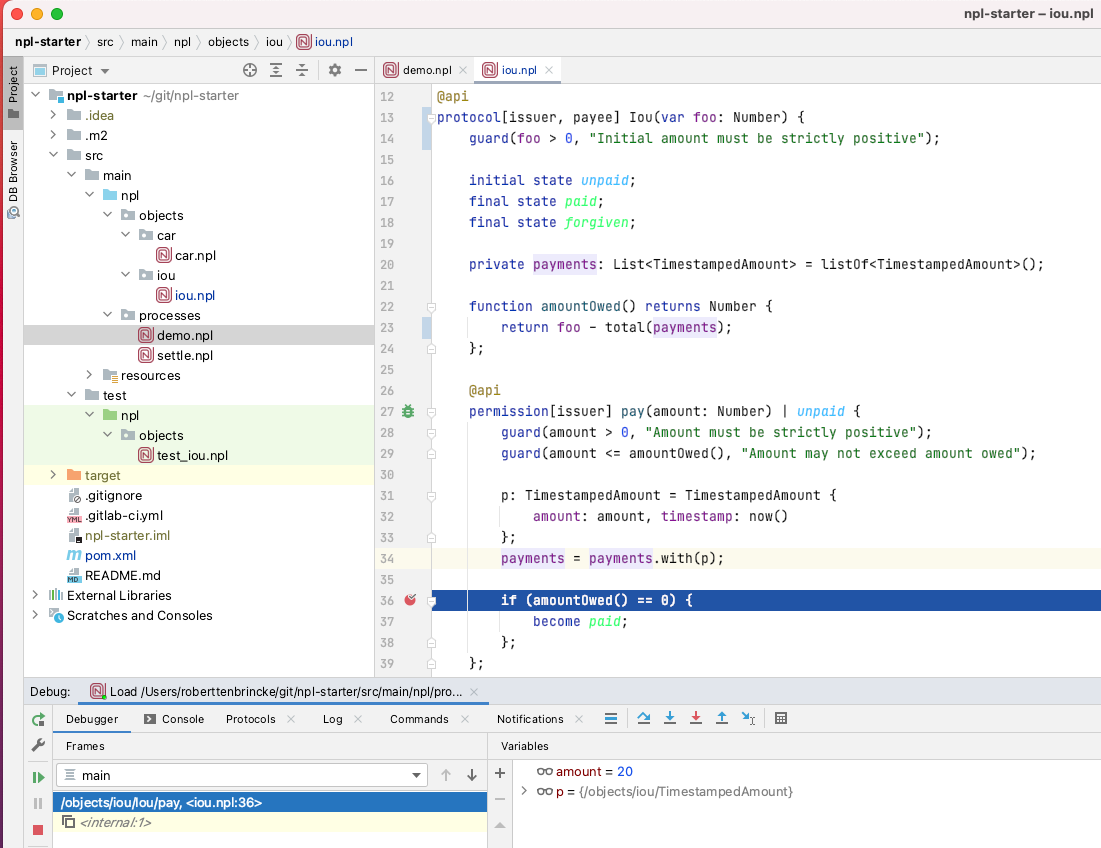
The debugger is now awaiting user input. For example, hit Step Into (F7) to step into the amountOwed function, or
Step Over (F8) to skip past this break point.
Dirty (intermediate) engine state
While debugging, protocol states are highlighted with a contrasting colour. These are dirty (intermediate) states that represent states that have not yet been committed - they are the result of the transaction that is in progress and allow you to inspect protocol instances.
Actions cannot be executed when dirty protocol states are pending, as this could cause unexpected behaviour.
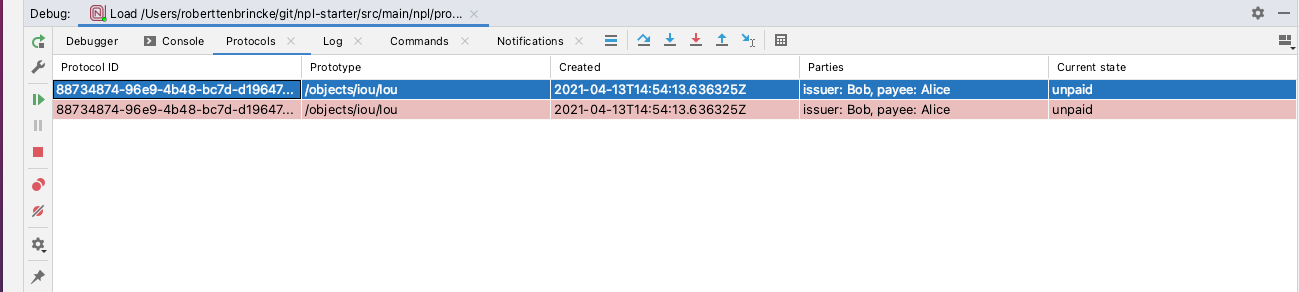
Dirty engine state is available for protocol states, commands, and notifications.
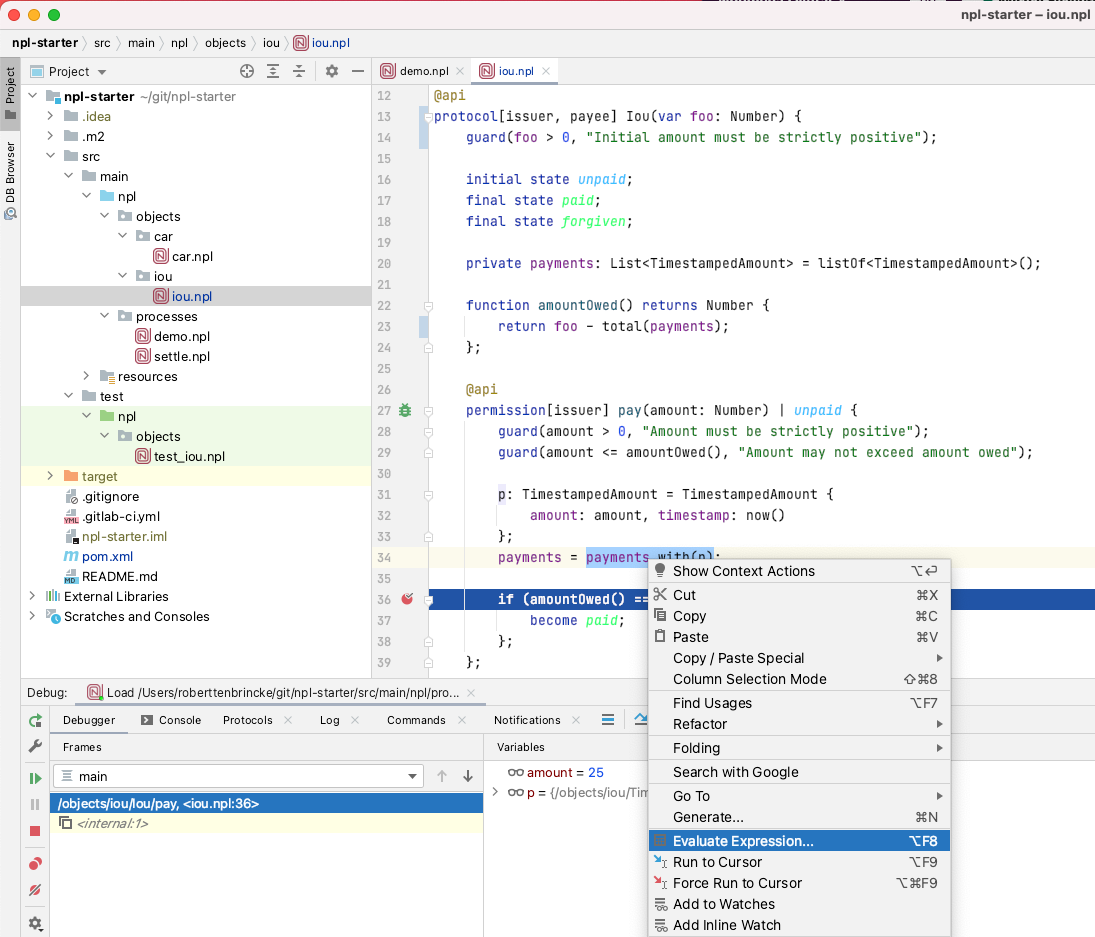
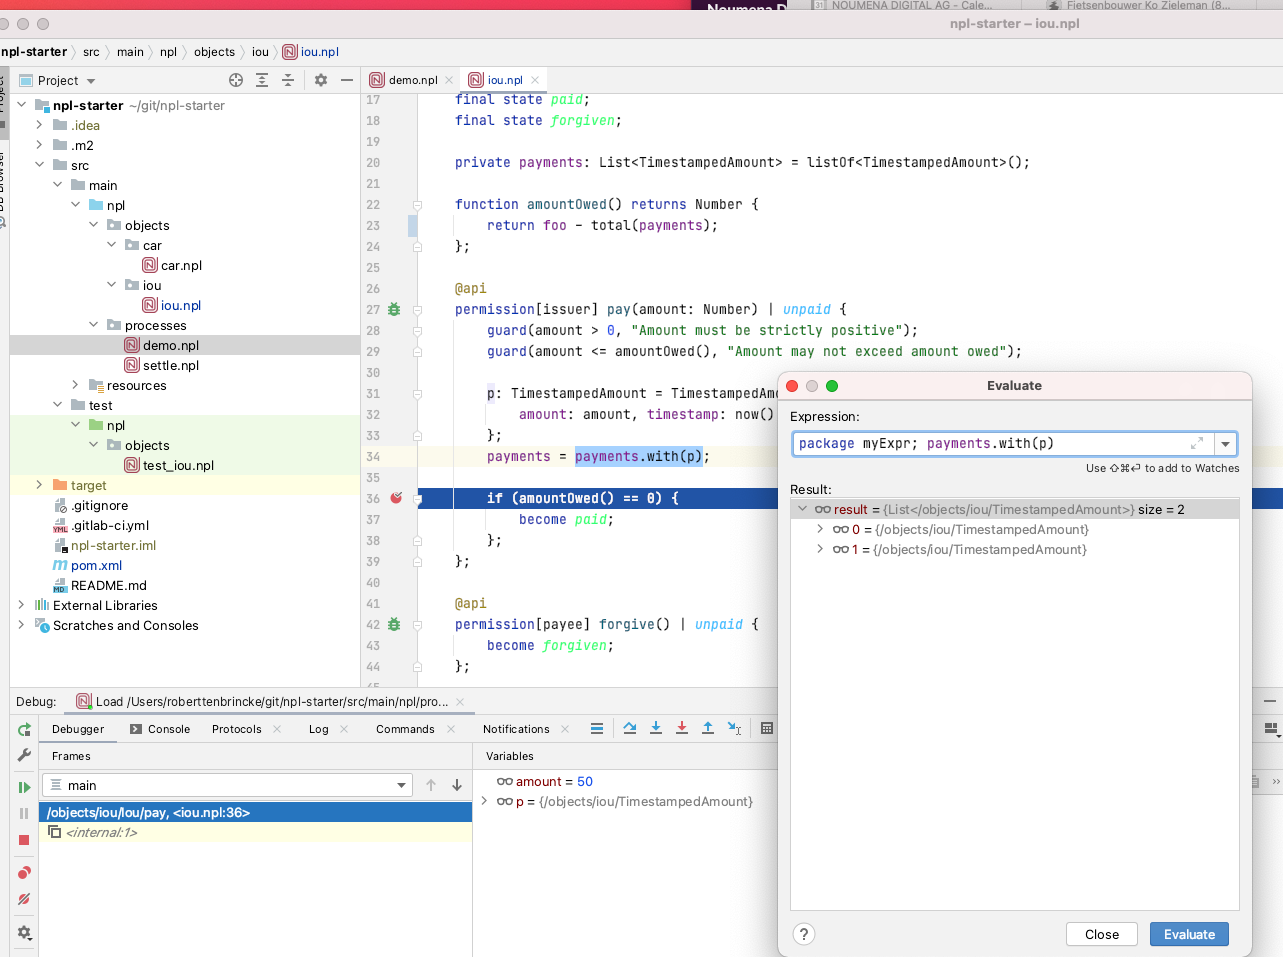
Expression evaluation
It's possible to evaluate expressions while debugging too. For example, you might be interested to see what the result of a partial expression is in order to work out flaws in its logic. You can select an expression, right-click it and select "Evaluate Expression...", or you can invoke expression evaluation directly using the appropriate key combination or click the calculator icon.